NFL Sports Prediction Part 2: Exploratory Data Analysis via ydata_profiling
Part 2 - Exploratory Data Analysis via ydata_profiling
Column definitions
cont_cols = [
    'D_datediff',              # Days since last game (Home - visitor)

    # first downs
    'D_First_Downs',

    # Basic Stats
    'D_Rush',                  # Number of running plays attempted
    'D_Yds',                   # Yards gained through running plays
    'D_TDs',                   # Touchdowns scored via running plays
    'D_Cmp',                   # Completions (# of successful passes)
    'D_Att',                   # Attempts (# of passes thrown, completed or not)
    'D_Yd',                    # Yards (Yards the passes have covered)
    'D_TD',                    # Touchdowns
    'D_INT',                   # Interceptions
    'D_Sacked',                # Number of times quarterback was tackled behind line of scrimmage
    'D_Yards',                 # Yards lost from sacks
    'D_Net_Pass_Yards',        # Net passing yards (total yds - yards lost due to sacks)
    'D_Total_Yards',           # Total yards gained (net pass yards + rushing yds)
    'D_Fumbles',               # Number of times ball was fumbled
    'D_Lost',                  # Number of times the team lost possession of the ball due to a fumble
    'D_Turnovers',             # Total number of turnovers, includes interceptions & fumbles lost
    'D_Penalties',             # Number of penalties committed by the team

    # Passing Detailed
    'D_passing_att',           # Passes attempted
    'D_passing_cmp',           # Passes completed
    'D_passing_int',           # Interceptions thrown
    'D_passing_lng',           # Longest completed pass
    'D_passing_sk',            # Passing times sacked
    'D_passing_td',            # Passing touchdowns
    'D_passing_yds',           # Yards gained by passing

    # Receiving
    'D_receiving_lng',         # Longest reception
    'D_receiving_td',          # Receiving touchdowns
    'D_receiving_yds',         # Receiving yards

    # Rushing Detailed
    'D_rushing_att',           # Rushing attempts (sacks not included)
    'D_rushing_lng',           # Longest rushing attempt (sacks not included)
    'D_rushing_td',            # Rushing touchdowns
    'D_rushing_yds',           # Rushing yards

    # Defense interceptions
    'D_def_interceptions_int', # Passes intercepted on defense
    'D_def_interceptions_lng', # Longest interception returned
    'D_def_interceptions_td',  # Interceptions returned for touchdown
    'D_def_interceptions_yds', # Yards interceptions were returned

    # Defense fumbles
    'D_fumbles_ff',            # Num of times forced a fumble by the opposition recovered by either team
    'D_fumbles_fr',            # Fumbles recovered by player or team
    'D_fumbles_td',            # Fumbles recovered resulting in touchdown for receiver
    'D_fumbles_yds',           # Yards recovered fumbles were returned

    # Defense tackles
    'D_sk',                    # Sacks
    'D_tackles_ast',           # Assists on tackles
    'D_tackles_comb',          # Solo + ast tackles
    'D_tackles_solo',          # Tackles

    # Kick Returns
    'D_kick_returns_lng',      # Longest kickoff return
    'D_kick_returns_rt',       # Kickoff returns
    'D_kick_returns_td',       # Kickoffs returned for a touchdown
    'D_kick_returns_yds',      # Yardage for kickoffs returned

    # Punt Returns
    'D_punt_returns_lng',      # Longest punt return
    'D_punt_returns_ret',      # Punts returned
    'D_punt_returns_td',       # Punts returned for touchdown
    'D_punt_returns_yds',      # Punts return yardage

    # Punting / Scoring
    'D_punting_lng',           # Longest punt
    'D_punting_pnt',           # Times punted
    'D_punting_yds',           # Total punt yardage
    'D_scoring_fga',           # Field goals attempted
    'D_scoring_fgm',           # Field goals made
    'D_scoring_xpa',           # Extra points attempted
    'D_scoring_xpm',           # Extra points made

    # Additional, calculated metrics
    'D_pythagorean',           # NFL variation of Bill James pythagorean expectation (from wikipedia)
]
Categorical columns
There are no categorical columns to handle in this dataset.
Missing values
Skipping this since it’s not necessary based on how the D_ columns are composed. This is more effective earlier on. It may be helpful to check.
Skewness
I set the skewness alert to fire when > 1. No columns exceeded this range. Otherwise, the skewed columns would have to be handled so it turns into a more normal distribution. Here is a helpful guide I found on kaggle regarding this
Observing the correlation matrix & removing strikingly similar columns
Using the correlation matrix, we can reduce the total number of columns by simply identifying columns that are striking similar to each other.
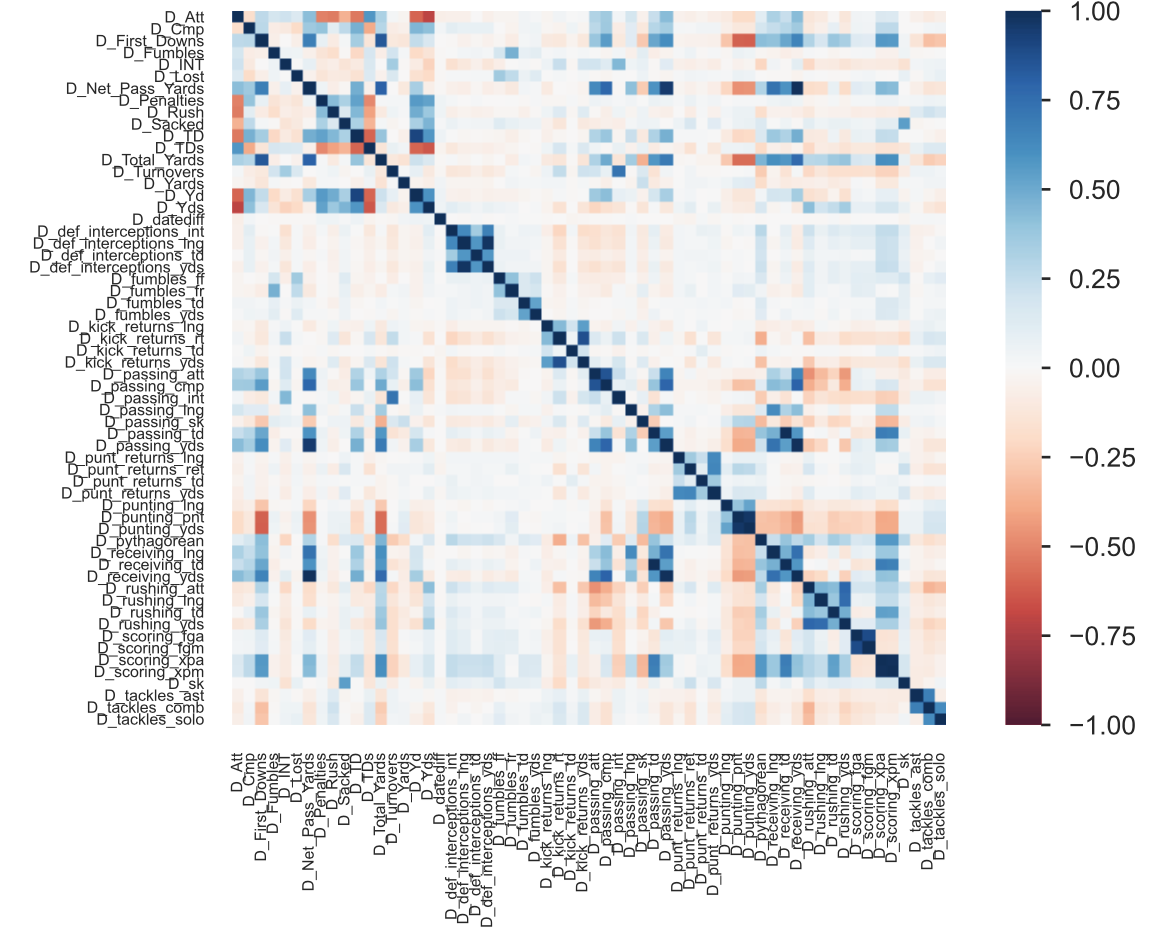
I selected the columns to retain based on my best judgment. The bold & highlighted cells will be preserved and the rest will be ignored.
| Similar column 1 | Similar column 2 | Similar column 3 |
|---|---|---|
| D_Net_Pass_Yards | D_passing_yds | D_receiving_yds |
| D_def_interceptions_lng | D_def_interceptions_yds | |
| D_passing_td | D_receiving_td | |
| D_scoring_fgm | D_scoring_fga | |
| D_scoring_xpm | D_scoring_xpa | |
| D_punting_pnt | D_punting_yds |
Through this analysis, we are dropping 7 columns: D_passing_yds, D_receiving_yds, D_def_interceptions_lng, D_receiving_td, D_scoring_fga, D_scoring_xpa, D_punting_pnt
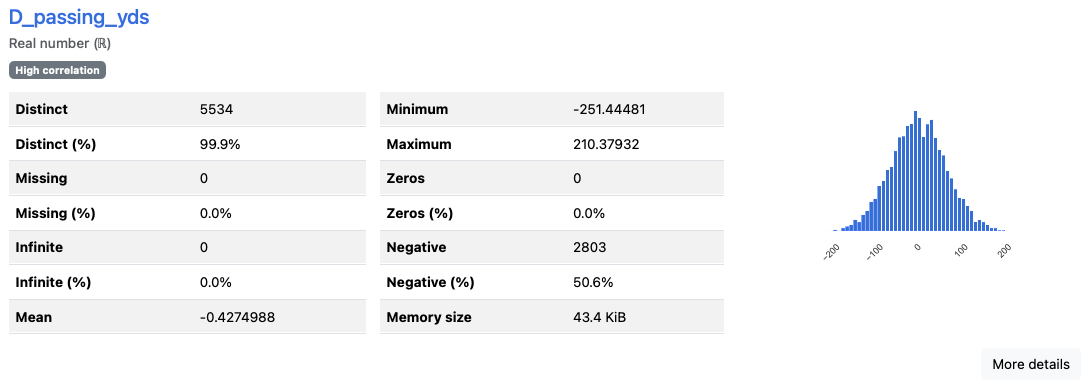
Reducing sig figs
Since an EMA is applied to the majority of columns, these columns ended up containing a 4 or more sig figs. This was observed by looking at the min & max values among items with a high distinct percentage. I decided to restrict the results to 3 sig figs.
Note that this won’t be necessary if I apply a standard scaler (helpful for an ANN), however I’m applying it anyway for the second ydata_profiling run.
Observe D_passing_yds:
You’ll find this post in your _posts directory. Go ahead and edit it and re-build the site to see your changes. You can rebuild the site in many different ways, but the most common way is to run jekyll serve, which launches a web server and auto-regenerates your site when a file is updated.
Jekyll requires blog post files to be named according to the following format:
YEAR-MONTH-DAY-title.MARKUP
Where YEAR is a four-digit number, MONTH and DAY are both two-digit numbers, and MARKUP is the file extension representing the format used in the file. After that, include the necessary front matter. Take a look at the source for this post to get an idea about how it works.
Jekyll also offers powerful support for code snippets:
def print_hi(name)
  puts "Hi, #{name}"
end
print_hi('Tom')
#=> prints 'Hi, Tom' to STDOUT.
Check out the [Jekyll docs][jekyll-docs] for more info on how to get the most out of Jekyll. File all bugs/feature requests at [Jekyll’s GitHub repo][jekyll-gh]. If you have questions, you can ask them on [Jekyll Talk][jekyll-talk].